Discrete Probability Distributions (Animal Science)
Discrete Probability Distributions
The probability distribution of a discrete random variable $X$ is the list of all possible values $X$ can take and the probabilities associated with them.
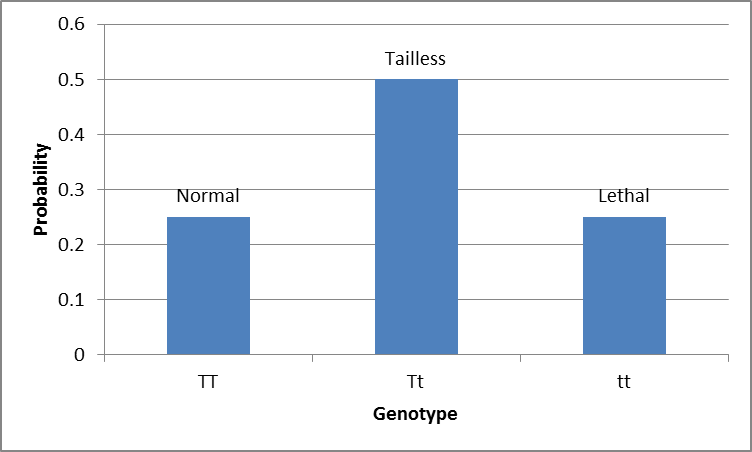
For example, the random variable $X$ could be the outcome of Mendelian inheritance. Suppose we have a pair of alleles represented by $T$, the dominant allele and $t$, the recessive allele. In cats, the heterozygous condition $Tt$ (which is the same as $tT$) results in the tailless Manx cat, the homozygous condition $TT$ is the normal cat with a tail and the combination $tt$ is lethal and these embryos do not develop. When two Manx cats are mated, there are four equally likely genotypic outcomes: $TT$, $Tt$, $tT$ and $tt$ each with probability $0.25$. Since $Tt$ results in the same condition as $tT$ we can consider these two outcomes as a single outcome with probability $0.25 + 0.25 = 0.5$ (i.e. when we say $Tt$ from now on we mean $Tt$ or $tT$). A chart of the probability distribution for the genotypes is shown below.

Of the many different discrete probability distributions, there are two that are particularly relevant to biological science, they are the Binomial and Poisson distributions.
The Binomial Distribution
The Binomial distribution is used when there are only two possible outcomes to what is known as a trial, e.g. an animal has a particular disease or not, an animal is pregnant or not. In statistics, we often use the term success in a trial to denote one of the outcomes and failure to denote the other. The conditions under which the Binomial distribution is used are summed up below.
Suppose the following statements hold:
- • There are a fixed number of trials;
- • There are only two possible outcomes for each trial (‘success’ or ‘failure’);
- • There is a constant probability $p$ of ‘success’;
- • The outcome of each trial is independent of any other trial.
Then the number of successes follows a Binomial distribution.
As an example, suppose we take blood samples from six cattle randomly selected from the population. Each animal in the population is either seropositive for Leptospira (a success) or not (a failure). We know that approximately $30\%$ of cattle in the population are seropositive for Leptospira so we take the probability of success to be $p = 0.3$. This situation fits the conditions for the Binomial distribution and although we won't go into the details here, there is a formula that tells us the probabilities of each of the possible outcomes. If you are interested in the formula, you can read about it here. The possible outcomes are that either, $0, 1, 2, ..., 6$ of the cattle are seropositive. The probabilities of each of the possible outcomes are listed below.
Number of seropositive cattle |
Probability |
|---|---|
0 |
0.1176 |
1 |
0.3025 |
2 |
0.3241 |
3 |
0.1852 |
4 |
0.0595 |
5 |
0.0102 |
6 |
0.0007 |
Notice that (aside from rounding errors) these probabilities add up to $1$.
The Poisson Distribution
If the following conditions hold:
- • There is no natural upper limit to the number of occurrences of an event;
- • Events occur independently, at a constant rate (on average),
then the number of events occurring has a Poisson distribution. A Poisson distribution is used when we are counting the number of events occurring randomly and independently in time or space at a constant rate (on average). For example, we might be interested in the number of blood cells in a diluted blood sample of a certain volume. As with the Binomial distribution, there is a formula that tells us the probabilities for the Poisson distribution as long as we know the average rate at which the events occur. Both the mean and variance of the Poisson distribution are equal to the average rate. If you would like to, you can read more about the Poisson distribution here.